Daily Open Line (9:30-16:00)This indicator automatically plots a horizontal line at each day's opening price during regular trading hours (9:30 AM to 4:00 PM, US Eastern Time).
The line starts exactly at the opening bar of the day and ends at the close (16:00).
Each day, a new line is drawn, making it easy to visualize and reference the daily open price throughout the session.
Useful for intraday traders to identify key support/resistance and monitor price action relative to the open.
You can customize the color, line width, and whether to display the open price label.
Search in scripts for "horizontal line"

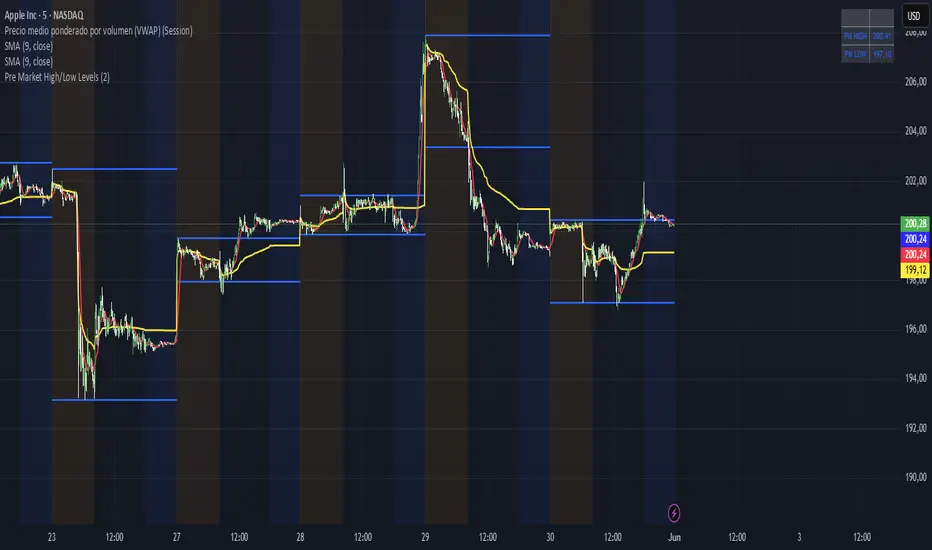
Pre Market High/Low LevelsPre Market High & Pre Market Low By Jadra
Pre Market High/Low Levels Indicator
This indicator automatically identifies pre-market high and low levels (4:00-9:30 AM ET) and marks them with blue horizontal lines that extend throughout the entire trading session. Perfect for NYSE and NASDAQ traders who use these key levels as support and resistance. Features color-coded backgrounds: yellow for pre-market, transparent for regular hours, and blue for post-market. Lines remain visible from pre-market through market close, providing constant visual references for making trading decisions based on these important psychological levels. Essential tool for day traders focusing on overnight price action and gap analysis in US equity markets.
Essa - Multi-Timeframe LevelsEnhanced Multi‐Timeframe Levels
This indicator plots yearly, quarterly and monthly highs, lows and midpoints on your chart. Each level is drawn as a horizontal line with an optional label showing “ – ” (for example “Apr 2025 High – 1.2345”). If two or more timeframes share the same price (within two ticks), they are merged into a single line and the label lists each timeframe.
A distance table can be shown in any corner of the chart. It lists up to five active levels closest to the current closing price and shows for each level:
level name (e.g. “May 2025 Low”)
exact price
distance in pips or points (calculated according to the instrument’s tick size)
percentage difference relative to the close
Alerts can be enabled so that whenever price comes within a user-specified percentage of any level (for example 0.1 %), an alert fires. Once price decisively crosses a level, that level is marked as “broken” so it does not trigger again. Built-in alertcondition hooks are also provided for definite breaks of the current monthly, quarterly and yearly highs and lows.
Monthly lookback is configurable (default 6 months), and once the number of levels exceeds a cap (calculated as 20 + monthlyLookback × 3), the oldest levels are automatically removed to avoid clutter. Line widths and colours (with adjustable opacity for quarterly and monthly) can be set separately for each timeframe. Touches of each level are counted internally to allow future extension (for example visually emphasising levels with multiple touches).

RSI Multi-TF TabRSI Multi-Timeframe Table 📊
A tool for multi-timeframe RSI analysis with visual overbought/oversold level highlighting.
Description
This indicator calculates the Relative Strength Index (RSI) for the current chart and displays RSI values across five additional timeframes (15m, 1h, 4h, 1d, 1w) in a dynamic table. The color-coded system simplifies identifying overbought (>70), oversold (<30), and neutral zones. Visual signals on the chart enhance analysis for the current timeframe.
Key Features
✅ Multi-Timeframe Analysis :
Track RSI across 15m, 1h, 4h, 1d, and 1w in a compact table.
Color-coded alerts:
🔴 Red — Overbought (potential pullback),
🔵 Blue — Oversold (potential rebound),
🟡 Yellow — Neutral zone.
✅ Visual Signals :
Background shading for oversold/overbought zones on the main chart.
Horizontal lines at 30 and 70 levels for reference.
✅ Customizable Settings :
Adjust RSI length (default: 14), source (close, open, high, etc.), and threshold levels.
How to Use
Table Analysis :
Compare RSI values across timeframes to spot divergences (e.g., overbought on 15m vs. oversold on D).
Use colors for quick decisions.
Chart Signals :
Blue background suggests bullish potential (oversold), red hints at bearish pressure (overbought).
Always confirm with other tools (volume, trends, or candlestick patterns).
Examples :
RSI(1h) > 70 while RSI(4h) < 30 → Possible reversal upward.
Sustained RSI(1d) above 50 may indicate a bullish trend.
Settings
RSI Length : Period for RSI calculation (default: 14).
RSI Source : Data source (close, open, high, low, hl2, hlc3, ohlc4).
Overbought/Oversold Levels : Thresholds for alerts (default: 70/30).
Important Notes
No direct trading signals : Use this as an analytical tool, not a standalone strategy.
Test strategies historically and consider market context before trading.


Custom Paul MACD-likePaul MACD is an indicator created by David Paul. It is implemented to effectively represent trend periods and non-trend (sideways/consolidation) periods, and its calculation method is particularly designed to reduce whipsaw.
Unlike the existing MACD which uses the difference between short-term (12) and long-term (26) exponential moving averages (EMA), Paul MACD has a different calculation method. This indicator uses a "center value" or "intermediate value". Calculation occurs when this intermediate value is higher than the High value (specifically, the difference between the center and High is calculated) or lower than the Low value (specifically, the difference between the center and Low is calculated). Otherwise, the value becomes 0. Here, the High and Low values are intended to be smoothly reflected using Smoothed Moving Average (SMMA). The indicator's method itself (using SMMA and ZLMA) is aimed at diluting whipsaws.
Thanks to this calculation method, in sections where whipsaw occurs, meaning when the intermediate value is between High and Low, the indicator value is expressed as 0 and appears as a horizontal line (zero line). This serves to visually clearly show sideways/consolidation periods.

TICK Extreme Levels & AlertsAutomatically draws horizontal lines at +1000 and -1000 TICK levels
Sends alerts when TICK crosses those levels (for potential scalping/reversal setups)
Strategy: How to Use TICK in Real-Time Trading
1. Confirm Market Breadth
Use TICK to confirm broad participation in the move:
• Long S&P futures or SPY? Only buy breakouts if TICK is above +600 to +1000
• Shorting? Confirm with TICK below –600 to –1000
2. Fade Extremes for Scalps
Look for reversals at extreme levels:
• Fade +1200+: market likely overbought short term → scalp short
• Fade –1200–: market likely oversold → scalp long
Use in combo with other signals (like price exhaustion, candlestick reversal, or VWAP touches)
3. Avoid Trading in the Choppy Zone
If TICK remains between –400 and +400, institutions are not committed. This is where fakeouts are common.
4. Time Entries with TICK Swings
For example:
• TICK moves from –800 to +600 = momentum shift → look for long entries
• TICK stalling around +1000 = momentum climax → partial profit or fade play

Algo Structure [ValiantTrader_]Explanation of the "Algo Structure" Trading Indicator
This Pine Script indicator, created by ValiantTrader_, is a multi-timeframe swing analysis tool that helps traders identify key price levels and market structure across different timeframes. Here's how it works and how traders can use it:
Core Components
1. Multi-Timeframe Swing Analysis
The indicator tracks swing highs and lows across:
The current chart timeframe
A higher timeframe (weekly by default)
An even higher timeframe (monthly by default)
2. Swing Detection Logic
Current timeframe swings: Identified when price makes a 3-bar high/low pattern
Higher timeframe swings: Uses the highest high/lowest low of the last 3 bars on those timeframes
3. Visual Elements
Horizontal lines marking swing points
Labels showing the timeframe and percentage distance from current price
An information table summarizing key levels
How Traders Use This Indicator
1. Identifying Key Levels
The indicator draws recent swing highs (red) and swing lows (green)
These levels act as potential support/resistance areas
Traders watch for price reactions at these levels
2. Multi-Timeframe Analysis
By seeing swings from higher timeframes (weekly, monthly), traders can:
Identify more significant support/resistance zones
Understand the broader market context
Spot confluence areas where multiple timeframes align
3. Measuring Price Distance
The percentage display shows how far current price is from each swing level
Helps assess potential reward/risk at current levels
Shows volatility between swings (wider % = more volatile moves)
4. Table Summary
The info table provides a quick reference for:
Exact price levels of swings
Percentage ranges between highs and lows
Comparison across timeframes
5. Trading Applications
Breakout trading: When price moves beyond a swing high/low
Mean reversion: Trading bounces between swing levels
Trend confirmation: Higher highs/lows in multiple timeframes confirm trends
Support/resistance trading: Entering trades at swing levels with other confirmation
Customization Options
Traders can adjust:
The higher timeframes analyzed
Whether to show the timeframe labels
Whether to display swing levels
Whether to show the info table
The indicator also includes price alerts for new swing highs/lows on the current timeframe, allowing traders to get notifications when market structure changes.
This tool is particularly valuable for traders who incorporate multi-timeframe analysis into their strategy, helping them visualize important price levels across different time perspectives

SuperTrend Confluence Signals [AlgoAlpha]OVERVIEW
This script enhances the classic SuperTrend indicator by integrating volume dynamics, retracement detection, and a multi-asset trend matrix—alongside an automatic mitigation-level drawing system. It's designed for traders who want to see not just trend direction, but the confluence of trend strength, volatility-adjusted retracements, and capital flow through volume pressure. It visually maps key transitions in market structure while offering a clean, color-coded overview of multiple symbols and timeframes in a single chart.
CONCEPTS
At the core is the traditional SuperTrend , which determines directional bias using Average True Range (ATR) with a volatility multiplier. This script overlays that with a dynamic volume histogram that scales relative to recent volume standard deviation, coloring volume bursts within the trend. Retracement signals are triggered when price pulls back toward the SuperTrend level but respects it—quantified through normalized distance sensitivity. On top of that, the indicator automatically draws and manages horizontal support/resistance zones that appear at key trend shifts. These levels persist and are cleared based on configurable rules such as wick/body sweeps or consecutive candle closes. A multi-asset, multi-timeframe table then gives an instant snapshot of trend status across five user-defined symbols and timeframes.
FEATURES
SuperTrend : Configurable ATR length and multiplier for flexible trend sensitivity.
Volumetric Histogram : Gradient-filled candles anchored to SuperTrend bands, scaled by relative volume to indicate activity intensity during trends.
Retracement Arrows : Signals printed when price nears the SuperTrend level without breaking it, allowing identification of high-probability continuation zones.
Volume TP Markers : Diamond markers flag high-volume events, contextualizing price moves with liquidity bursts.
Automatic Structure Levels : Draws clean horizontal lines at significant trend transitions, with optional volatility-based band fills. These levels self-update and clear based on price interaction logic.
Trend Table : Displays trend direction (▲/▼) across five assets and five timeframes. Each cell is colored according to trend bias, providing a compact overview for multi-market confluence.
USAGE
Start by loading the indicator on your main chart and adjusting the ATR Length and Multiplier to match your strategy timeframe. Use lower values for scalping and higher values for swing trading. The histogram bars will appear as colored candles above or below the SuperTrend level, indicating how strong volume is within that trend. Arrow signals suggest minor pullbacks within the trend, which can act as entry opportunities. The level system will automatically plot key price zones during trend flips; if "Body" is selected for mitigation, price must close through the level to invalidate it. If "Wick" is chosen, a single wick breach is enough. Adjust expiry and rejection settings to fine-tune how long levels stay on chart. Finally, enable the Multi-Asset Table to view live trend signals across popular symbols like AAPL or NVDA in different timeframes, helping spot macro-to-micro alignment for higher-confidence trades.

MA OrderlinessMA Orderliness measures how well a series of simple moving averages (SMAs) are stacked in the expected order for a trending market and turns that measurement into a normalized oscillator. You choose how many MAs to include and the shortest and longest lengths. The script generates a family of evenly spaced SMAs between those lengths, then compares each pair: shorter MAs should lie above longer ones in an uptrend and below in a downtrend. When any pair is out of order, a “violation” score is accumulated, but violations between nearby MAs count more heavily than those between MAs that are far apart. All weights are summed, and the total weighted violations are converted into a score from –1 (completely reversed) to +1 (perfectly ordered).
This orderliness score is plotted as a line oscillator. A fixed horizontal line at +1 marks perfect order, and another at –1 marks perfect reversal. To smooth the raw oscillator and generate trading signals, the script also plots a simple moving average of the orderliness score over a user-defined period. When the unsmoothed score crosses above its moving average, a bullish crossover alert fires. When it crosses below, a bearish crossover alert fires.
Everything is calculated on each bar so you can see the oscillator evolve in real time. You can customize the number of MAs, their minimum and maximum lengths, and the length of the signal-line SMA to suit different timeframes or markets.

Mimas buy and sellBollinger Bands: Calculated using a simple moving average (basis) and standard deviation (dev).
EMAs: Two exponential moving averages (EMA 5 and EMA 20) are plotted to identify short-term and long-term trends.
Price Action Patterns: The script detects higher highs and higher lows for bullish conditions, and lower highs and lower lows for bearish conditions.
Trend Strength: An exponential moving average of the price change is used to gauge the strength of the trend.
Trade Signals: Buy and sell signals are plotted on the chart when specific conditions are met, combining price action patterns, trend strength, Bollinger Bands, and EMA crossovers.
Take-Profit Levels: Dynamic take-profit levels are calculated based on recent swing highs and lows, adjusted by a user-defined multiplier. These levels are displayed on the chart using plot to draw horizontal lines.

RTH Session Range Position (0-100) with EMAA Pine Script indicator designed to help traders understand where the current price is located within the Regular Trading Hours (RTH) session range, from 0 (session low) to 100 (session high). It also plots a smoothed EMA of this position to provide insight into momentum or trend during the RTH session.
What the Indicator Does
Defines RTH (Regular Trading Hours):
Start: 9:30 AM
End: 4:00 PM
These are typical US equity market hours.
Tracks the session's high and low during RTH:
sessionHigh and sessionLow update only during RTH.
Calculates position of the current price within the RTH range:
Formula: ((close - sessionLow) / (sessionHigh - sessionLow)) * 100
Result is a percentage:
0 = at session low
100 = at session high
50 = middle of session range
Calculates an EMA of that position (posEMA):
Smooths out the raw position to help visualize momentum within the range.
Plots and table:
Plots pos and posEMA on a separate chart pane.
Adds horizontal lines at key levels (0, 30, 50, 70, 100).
Table shows current values for Position, EMA, and Range.
Visual cues:
bgcolor highlights when pos crosses over or under the EMA — potential momentum shifts.
Alerts:
Cross above/below 50 (session midpoint).
Cross above/below EMA.
How to Use It Effectively
1. Session Strength & Momentum
Position above 70: Price is near session highs — strong upward momentum.
Position below 30: Price is near session lows — strong downward momentum.
Use the EMA of position to filter out noise and identify trends.
2. Breakout or Reversal Detection
Cross above EMA: Momentum may be turning bullish.
Cross below EMA: Momentum may be turning bearish.
These crosses (especially near mid-levels like 50) can hint at session trend shifts.
3. Range Context for Entries
If you're a mean-reversion trader, look for:
Price > 70 + turning down below EMA → possible short.
Price < 30 + turning up above EMA → possible long.
For breakout traders, you might wait for:
Crosses above 70 with EMA support.
Crosses below 30 with EMA resistance.
4. Confirmation Tool
Use this indicator alongside others to confirm:
Whether price action has strength within the day.
Whether breakouts have real momentum or are extended already.

Custom Session Tracker (KN)**Custom Session Tracker (KN)**
Visually highlight any intraday session’s high, low, and midpoint on your chart with full styling control.
**Description**
Custom Session Tracker (KN) lets you define any trading session (e.g. 09:30–16:00 NY time) and automatically draws:
* A translucent box spanning the session’s High and Low
* A horizontal line marking the session midpoint
All elements update in real time and persist after session close.
**Features**
* **Session Range Box**: Plots from session open through close
* **Mid-Price Line**: Marks the exact midpoint of High/Low
* **Timezone Input**: Aligns session to any GMT offset
* **Custom Colors**: Fill, border, and mid-line colors
* **Line & Border Styles**: Choose solid or dashed
**Inputs**
* **Timezone** – GMT offset for your market
* **Session** – Hours in `HHMM-HHMM` format
* **Fill Color** – Box interior transparency
* **Border Color** – Box outline
* **Box Border Style** – Solid or dashed
* **Midline Color** – Mid-price line color
* **Mid Price Line Style** – Solid or dashed
**How to Use**
1. Add the script to your chart.
2. Set your session hours and timezone.
3. Customize colors and styles.
4. Watch each session’s high, low, and midpoint appear automatically.
Perfect for session-overlap strategies, mean-reversion signals, or simply keeping key levels in view.

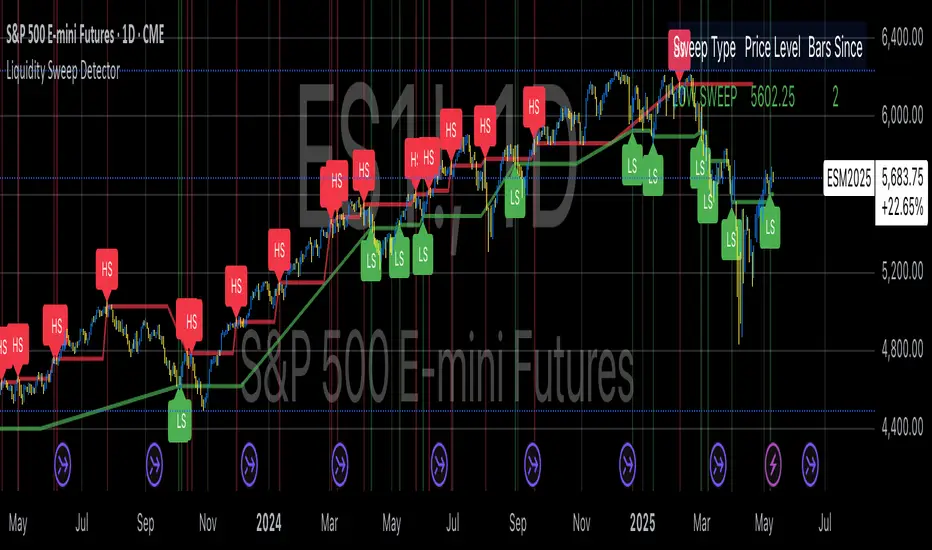
Liquidity Sweep DetectorThe Liquidity Sweep Detector represents a technical analysis tool specifically designed to identify market microstructure patterns typically associated with institutional trading activity. According to Harris (2003), institutional traders frequently employ tactics where they momentarily break through price levels to trigger stop orders before redirecting the market in the opposite direction. This phenomenon, commonly referred to as "stop hunting" or "liquidity sweeping," constitutes a significant aspect of institutional order flow analysis (Osler, 2003). The current implementation provides retail traders with a means to identify these patterns, potentially aligning their trading decisions with institutional movements rather than becoming victims of such strategies.
Osler's (2003) research documents how stop-loss orders tend to cluster around significant price levels, creating concentrations of liquidity. Taylor (2005) argues that sophisticated institutional participants systematically exploit these liquidity clusters by inducing price movements that trigger these orders, subsequently profiting from the ensuing price reaction. The algorithmic detection of such patterns involves several key processes. First, the indicator identifies swing points—local maxima and minima—through comparison with historical price data within a definable lookback period. These swing points correspond to what Bulkowski (2011) describes as "significant pivot points" that frequently serve as liquidity zones where stop orders accumulate.
The core detection algorithm utilizes a multi-stage process to identify potential sweeps. For high sweeps, it monitors when price exceeds a previous swing high by a specified threshold percentage, followed by a bearish candle that closes below the original swing high level. Conversely, for low sweeps, it detects when price drops below a previous swing low by the threshold percentage, followed by a bullish candle closing above the original swing low. As noted by Lo and MacKinlay (2011), these price patterns often emerge when large institutional players attempt to capture liquidity before initiating significant directional moves.
The indicator maintains historical arrays of detected sweep events with their corresponding timestamps, enabling temporal analysis of market behavior following such events. Visual elements include horizontal lines marking sweep levels, background color highlighting for sweep events, and an information table displaying active sweeps with their corresponding price levels and elapsed time since detection. This visualization approach allows traders to quickly identify potential institutional activity without requiring complex interpretation of raw price data.
Parameter customization includes adjustable lookback periods for swing point identification, sweep threshold percentages for signal sensitivity, and display duration settings. These parameters allow traders to adapt the indicator to various market conditions and timeframes, as markets demonstrate different liquidity characteristics across instruments and periods (Madhavan, 2000).
Empirical studies by Easley et al. (2012) suggest that retail traders who successfully identify and act upon institutional liquidity sweeps may achieve superior risk-adjusted returns compared to conventional technical analysis approaches. However, as cautioned by Chordia et al. (2008), such patterns should be considered within broader market context rather than in isolation, as their predictive value varies significantly with overall market volatility and liquidity conditions.
References:
Bulkowski, T. (2011). Encyclopedia of Chart Patterns (2nd ed.). John Wiley & Sons.
Chordia, T., Roll, R., & Subrahmanyam, A. (2008). Liquidity and market efficiency. Journal of Financial Economics, 87(2), 249-268.
Easley, D., López de Prado, M., & O'Hara, M. (2012). Flow Toxicity and Liquidity in a High-frequency World. The Review of Financial Studies, 25(5), 1457-1493.
Harris, L. (2003). Trading and Exchanges: Market Microstructure for Practitioners. Oxford University Press.
Lo, A. W., & MacKinlay, A. C. (2011). A Non-Random Walk Down Wall Street. Princeton University Press.
Madhavan, A. (2000). Market microstructure: A survey. Journal of Financial Markets, 3(3), 205-258.
Osler, C. L. (2003). Currency Orders and Exchange Rate Dynamics: An Explanation for the Predictive Success of Technical Analysis. Journal of Finance, 58(5), 1791-1820.
Taylor, M. P. (2005). Official Foreign Exchange Intervention as a Coordinating Signal in the Dollar-Yen Market. Pacific Economic Review, 10(1), 73-82.
Equal High/Low (EQH/EQL) [AlgoAlpha]OVERVIEW
This script detects and visualizes Equal High (EQH) and Equal Low (EQL) zones—key liquidity areas where price has previously stalled or reversed. These levels often attract institutional interest due to the liquidity buildup around them. The indicator is built to highlight such zones using dynamic thresholding, overbought/oversold RSI filtering, and adaptive mitigation logic to manage zone relevance over time.
CONCEPTS
Equal Highs/Lows are price points where the market has repeatedly failed to break past a certain high or low, hinting at areas where stop orders and pending interest may be concentrated. These areas are often prime targets for liquidity grabs or reversals. By combining this with RSI filtering, the script avoids false signals during neutral conditions and instead focuses on zones where market pressure is more directional.
FEATURES
Detection Logic: The script identifies EQH and EQL zones by comparing the similarity between recent highs or lows with a dynamic volatility threshold. The `tolerance` input allows users to control how strict this comparison is.
RSI Filtering: If enabled, it only creates zones when RSI is significantly overbought or oversold (based on the `state_thresh` input). This helps ensure zones form only in meaningful market conditions.
Zone Display: Bullish (EQL) zones are shown in grey, while bearish (EQH) zones are in blue. Two horizontal lines mark the zone using wick and body extremes, and a filled area visualizes the zone between them.
Zone Management: Zones automatically extend with price until they’re invalidated. You can choose whether a zone is removed based on wick or body sweeps and whether it requires one or two candle confirmations. Zones also expire after a customizable number of bars.
Alerts: Four alert conditions are built in—when a new EQH/EQL is formed and when one is mitigated—making it easy to integrate into alert-based workflows.
USAGE
Equal highs/lows can be used as liquidity markers, either as entry points or as take-profit targets.
This tool is ideal for liquidity-based strategies and helps traders map out possible reversal or sweep zones that often precede aggressive moves.

MC High/LowMC High/Low is a minimalist precision tool designed to show traders the most critical price levels — the High and Low of the current Day and Week — in real-time, without any visual clutter or historical trails.
It automatically tracks:
🔼 HOD – High of Day
🔽 LOD – Low of Day
📈 HOW – High of Week
📉 LOW – Low of Week
Each level is plotted using simple black horizontal lines, updated dynamically as the session evolves. Labels are clearly marked and positioned to the right of the screen for easy reference.
There’s no trailing history, no background colors, and no distractions — just pure price structure for clean confluence.
Perfect for:
Intraday scalpers
Swing traders
Liquidity & range traders
This is a tool built for sniper-level execution — straight from the MadCharts mindset.
🛠 Created by:
🔒 Version: Public Release
🎯 Use this with your favorite price action, liquidity, or market structure strategies.
